[Infographic] Print vs Digital: Who Survives The Zombies
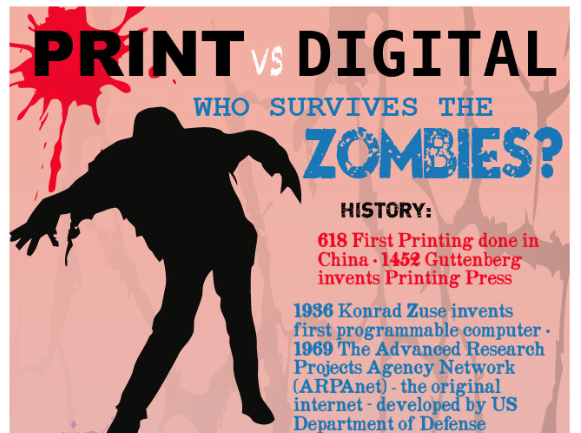
If you join us for #PrintChat Wednesday’s at 4PM ET, or follow PMC with some regularity, you know we like to keep it informative and FUN whenever possible. Such is the case with our Halloween #printchat. It started out discussing disaster plans which was a topical and serious matter considering Sandy had just devastated the […]
Infographic: 10 Myths About Graphic Design
Anyone who touches print from the creation side will appreciate this!! 10 Myths About Graphic Design by Patrick Jude Ilagan Throughout the years graphic designers have tried to dispel the myths surrounding graphic design and working as a graphic designer. While some myths are hilarious and particularly harmless, there are other myths that are annoying […]
The Psychology of Colors [infographic]
via: http://dailyinfographic.com/the-psychology-of-colors-infographic
Infographic: The State of Graphic Design
Welcome to the 2012 edition of the State of Graphic Design! via State of Graphic Design | Smartpress.com. Smartpress.com conducted a survey to aggregate the opinion of dozens of the best and most-talented graphic designers in the industry. The results were turned into a success factors/guide document in form of an infographic. This year the […]
[Infographic] The ROI of Web Content Personalization
Im on a bit of a segmenting/personalization kick and this plays nicely into it. Knowing who your visitors are is a nice thing, but knowing what they are interested in and looking at is even better. Based on the assumption that users will know their data is being collected (see CONSENT below), the opportunity to […]
Mac Person vs PC Person – The Infographic
Are you a MAC?… or a PC?… Seems there is a bit more to it than just your OS
Social Customer Service [infographic]
via Social Customer Service [infographic]. Social media has allowed companies to become more responsive than ever before. Today’s infographic Social Customer Service: The Next Competitive Battleground shows us that companies are responding quicker than ever to their customers complaints. In fact about 84% of social media use is geared towards improving customer service.
The Most Social Cities & Landmarks Per Facebook
Some of these make sense Landmark wise: Times Square, The Colosseum … some of these make sense as being Stadiums and Concert venues so people would “check-in” and there are consistent audiences… but in Oslow, Norway TGIF Friday’s is the social hot spot? They must make one hell of a burger! Any one even been? click […]
Free Wi-fi, Friend or Foe? [infographic]
via Free Wi-fi, Friend or Foe? [infographic]. As mobile devices become more and more popular the demand for easy access to wi-fi increases as well. It is already pretty easy to access wi-fi in most places including coffee shops, restaurants, the mechanics, etc. Access to wifi will only become wider spread and easier to access especially […]
Infographic: The Social Media Gender Divide
The study for this infographic was done in the UK about the UK, so there is that to consider, but seems like the percentages swing the way you would assume they would – except for the gaming category. That was a bit of a surprise. Infographic via : MediaBistro
Infographic: E-Books in America
I rarely consider myself a traditionalist, but when it comes to books I do prefer mine the old fashion way, or so I thought. Im not questioning the ink on paper part, Im questioning my thought that my preference is old fashioned – aka out of date, not cool etc. Have I been e-brainwashed to […]
VIDEO Infographic: A Marketer's Guide to Pinterest
This is pretty cool… a video info graphic from MDG Advertising – hmmm infovideo? Well whatever we call it there is no question that the subject matter is clear – Pinterest is here to stay and IF your audience is using it (most likely a good portion is) then you should be too. I know, […]